TRM visualization
The triangle shows how much benefit a business, product, team or vendor brings its customer, against what it costs the customer to get that value. It has one corner each for time, risk and money. The thick yellow shape is the value received. The thin pink shape is the value given up.
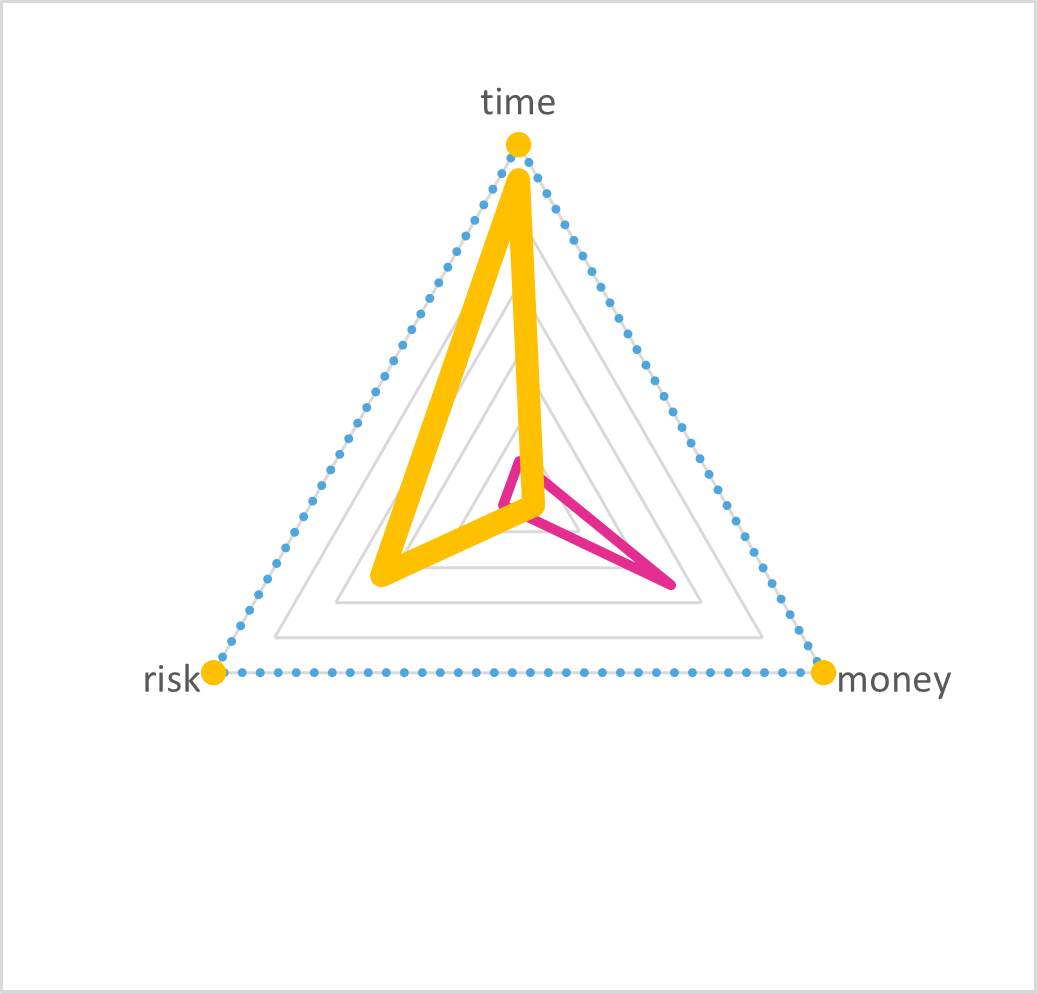
This could be a business buying security software, or a person moving from a checkbook to an online budgeting tool. The customer gets a big time saving and less risk. They give up money to get it.
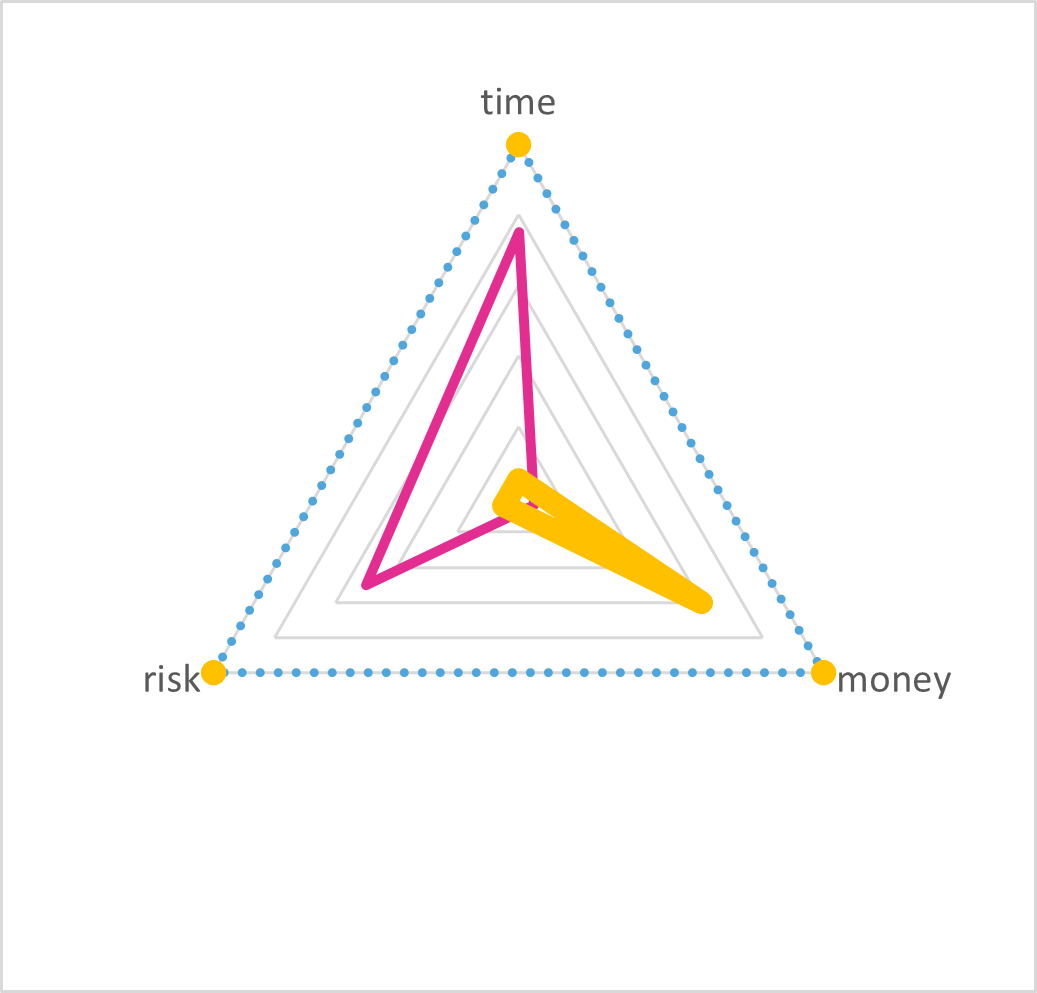
Here is a similar-looking graph with benefit and cost reversed. The value received is far smaller than the value given up. This is the example that led me to create TRM. We were focused on cutting costs, but we weren’t picking the right cuts. See the cost-cutting case study.