Case study: cost-cutting prioritization
In 2023 our engineering and IT department needed to bring vendor costs down 20%. How do you pick the right cuts? If we looked only at cost, we could leave the company crippled. We needed a way to weigh the price we’d pay against the benefit we were after. Enter the TRM analysis.
In each triangle below, the thick yellow shape is the value gained and the thin pink shape is the value given up. The score compares the two.
Poor choice (-45%)
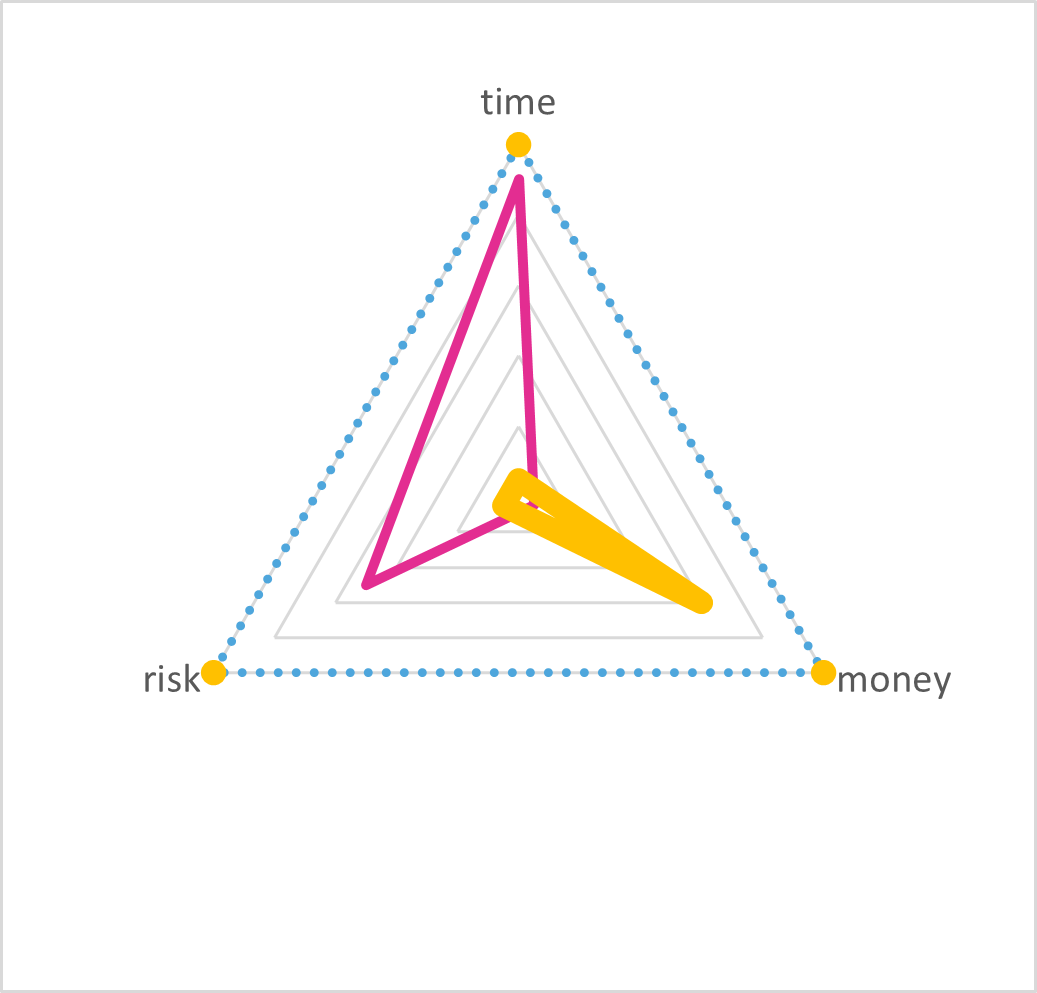
Before we used the triangle to think through cuts, we eliminated two vendors. That moved cost in the right direction, but it cost more than it gained. Notice how much bigger the price triangle is than the value.
Benefit. We hit the goal of lowering vendor costs.
Cost. The company was exposed to more risk, and employees now had to cover gaps the software used to fill. That is time.
That tradeoff can make sense. But the triangles for other options showed we didn’t need to take on that risk and time. (I can’t be specific, for obvious risk reasons.)
Good choice (+257%)
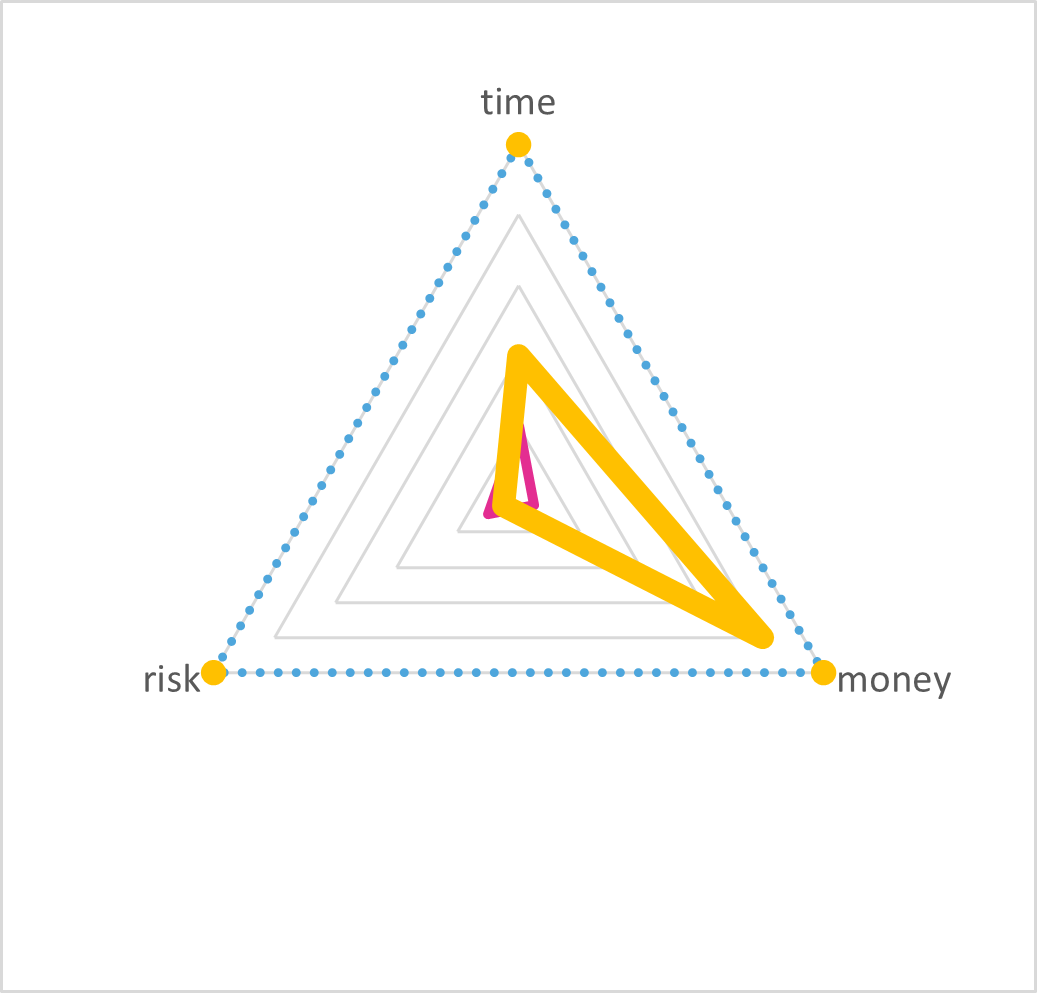
In engineering we ran four environments. One, UAT (user acceptance testing), was meant to be an identical copy of production, down to the load balancing and scaling policies. We removed it entirely.
Benefit. It was one of our biggest cost savings (sorry, AWS). It also saved time: developers no longer had to deploy code to one more environment and test it all over again.
Cost. No team was using it for its intended purpose. It wasn’t catching anything the lower environments missed, so it no longer reduced the risk of a bad deployment. It might in the future, and that should be re-evaluated.
Automation (+200%)
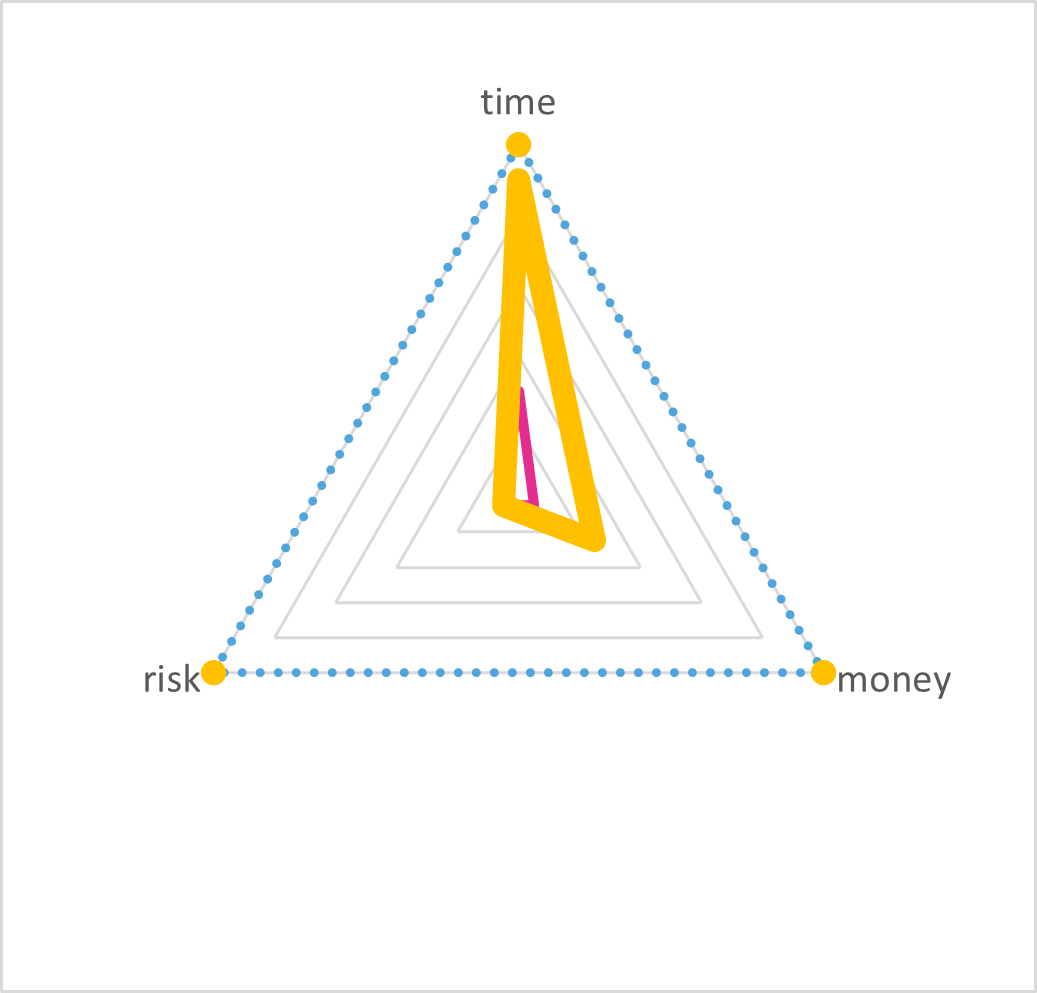
It wasn’t always about cost. Sometimes work that made big improvements elsewhere made more sense. A process for provisioning data stores slowed down both the product teams and the data team. That is time. What if we automated it?
Benefit. Capacity on the data team and the product teams went up dramatically. Conveniently, it also cut vendor costs, by moving to cheaper infrastructure.
Cost. If automating it were easy, we’d have done it sooner. Interestingly, the process existed to reduce risk. Reframing the problem in terms of value made automating it a clear winner.