Case study: platform engineering and IT
Explaining why platform engineering (DevOps, SRE, Data, QA and so on) and IT matter is hard, and not only for non-technical people. Each team also works in a very different space, which makes it hard to compare the value of their initiatives. This exact problem is what led me to create TRM.
Everything these teams create falls into time, risk or money. That made it easy to show progress every week, month and quarter. Our quarterly reviews looked something like the charts below. None of them is actual data.
Time
For time, we focused on where we could save the company the most. We showed time saved as a share of one full-time employee (FTE), to give it context. Hours sound impressive, with over two thousand working hours a year per FTE, but they don’t tell the company what it got. We also broke the savings down by the teams and departments that received them.
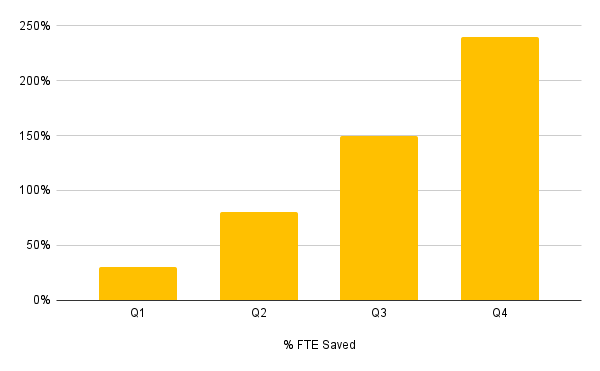
This one shows more than two FTEs’ worth of time saved by the end of the year.
Risk
We measured each risk by impact and likelihood. That gave every risk a score we could compare. The trick is showing where you are and where you came from.
This is my favorite visualization: a radar chart. The goal with risk is to reduce it as far as you can, but it will never be eliminated. On a radar chart the area shrinks as the company’s exposure shrinks.
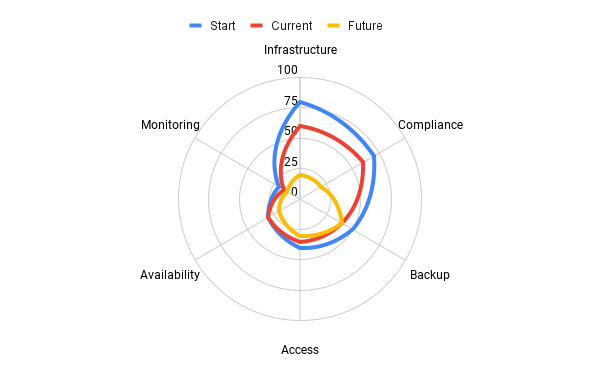
The chart shows at a glance where the company started, where it stands now and where it’s headed. At each point you can see where you’re doing well and where the opportunities are. Like time, it can be broken down further, by vendor for example.
Money
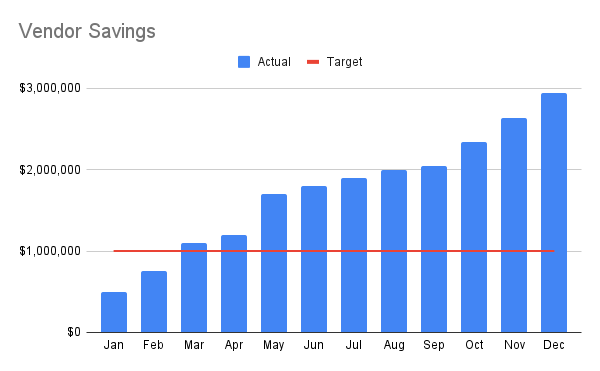
Money is the most straightforward of the three. Cutting vendor spend was our focus, so it’s where we spent the most time. I wish I could share our real tracking. Here is roughly what it looked like.
The teams
Each team has its own focus. How does each one line up with TRM? In each triangle, the thick yellow shape is the value the team creates and the thin pink shape is its price.
Every score here will vary from company to company and year to year. The bigger a team’s customer base, the more value it can provide.
DevOps (+43%)
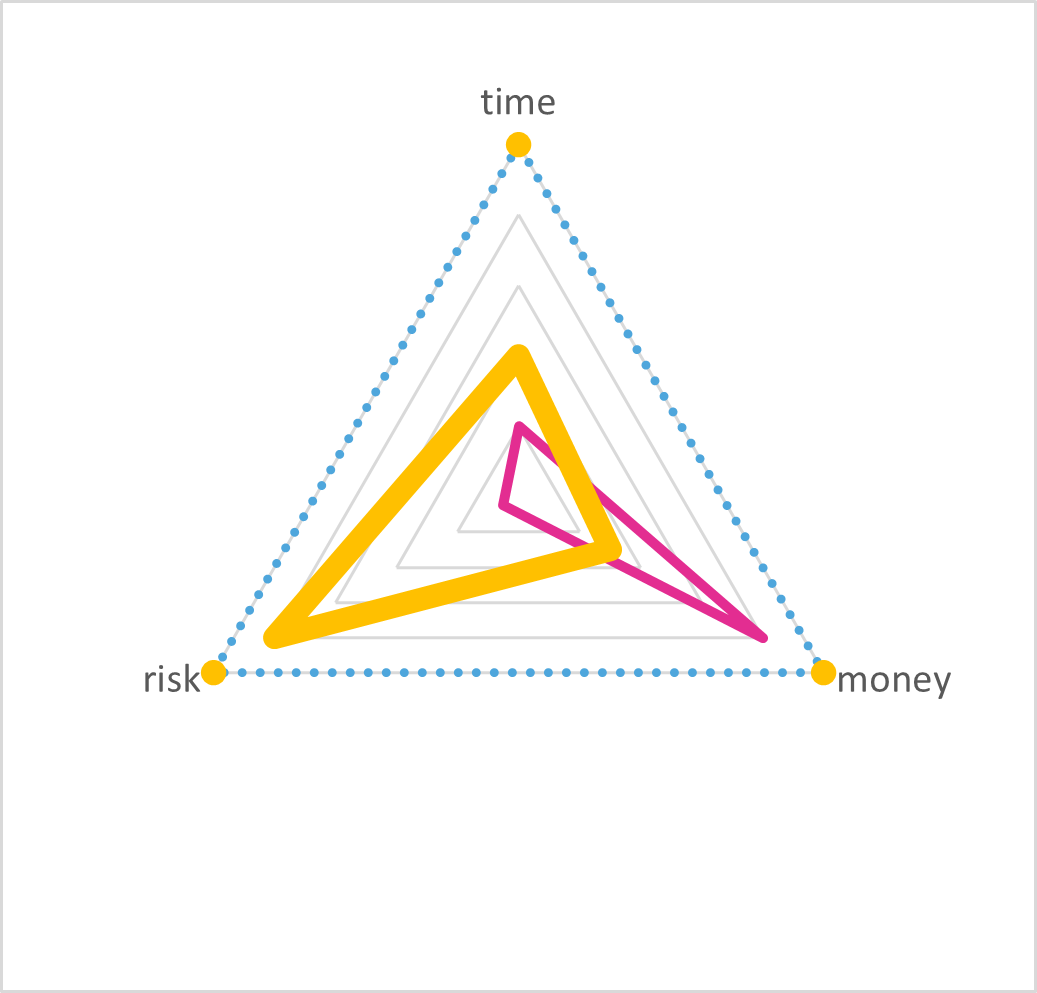
DevOps teams focus on CI/CD, deployments, production availability and security. How many people did I just confuse?
Value. DevOps serves three customers: product engineering, risk management and finance. For product engineering, it provides a structured, consistent environment where teams can test code and release it to production without dealing with the complexity of making that happen. That is time. For risk management, DevOps (or DevSecOps) makes sure environments, production above all, follow security and compliance best practice. And at SaaS companies especially, DevOps often holds the keys to the most expensive vendor spend. That makes it finance’s best friend or worst enemy.
Price. Like every team, DevOps costs money. DevOps engineers are paid above average, and they often take longer to onboard. That is time.
SRE (+38%)
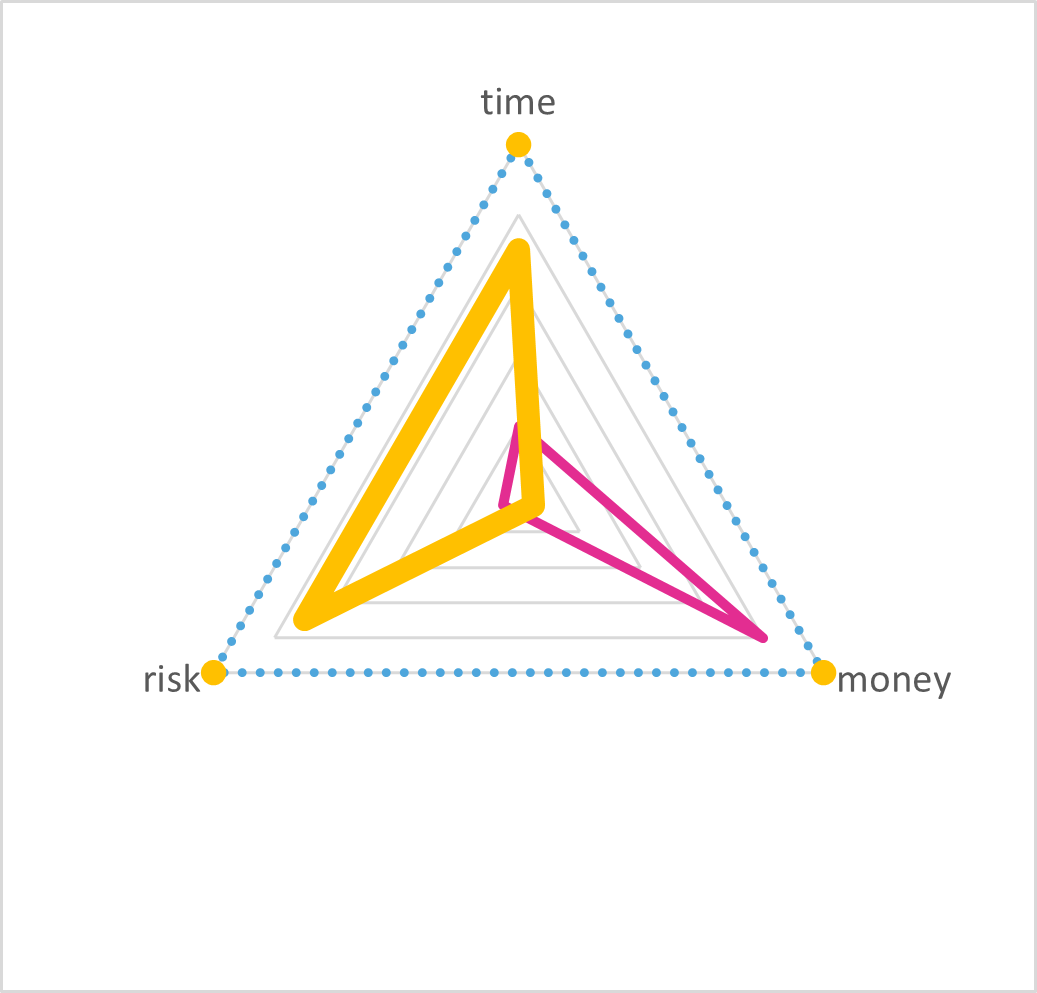
SRE teams focus on production monitoring, observability, alerting and availability. Clear?
Value. At a SaaS company, SRE has three main customers: risk management, product engineering and customer support. For risk management, SRE minimizes the impact of production incidents, by making them less frequent and handling them quickly. For product engineering, it makes it easy to tell when there is an incident (and when there isn’t), and provides the tools and training to resolve it quickly. That is time. It also provides processes so incidents don’t repeat. Customer support gains time too: it can see the scope of an incoming problem. Just this user? People on the east coast? Everyone?
Price. Like any team, there are people costs. There is also the cost of the observability tools.
QE/QA (+29%)
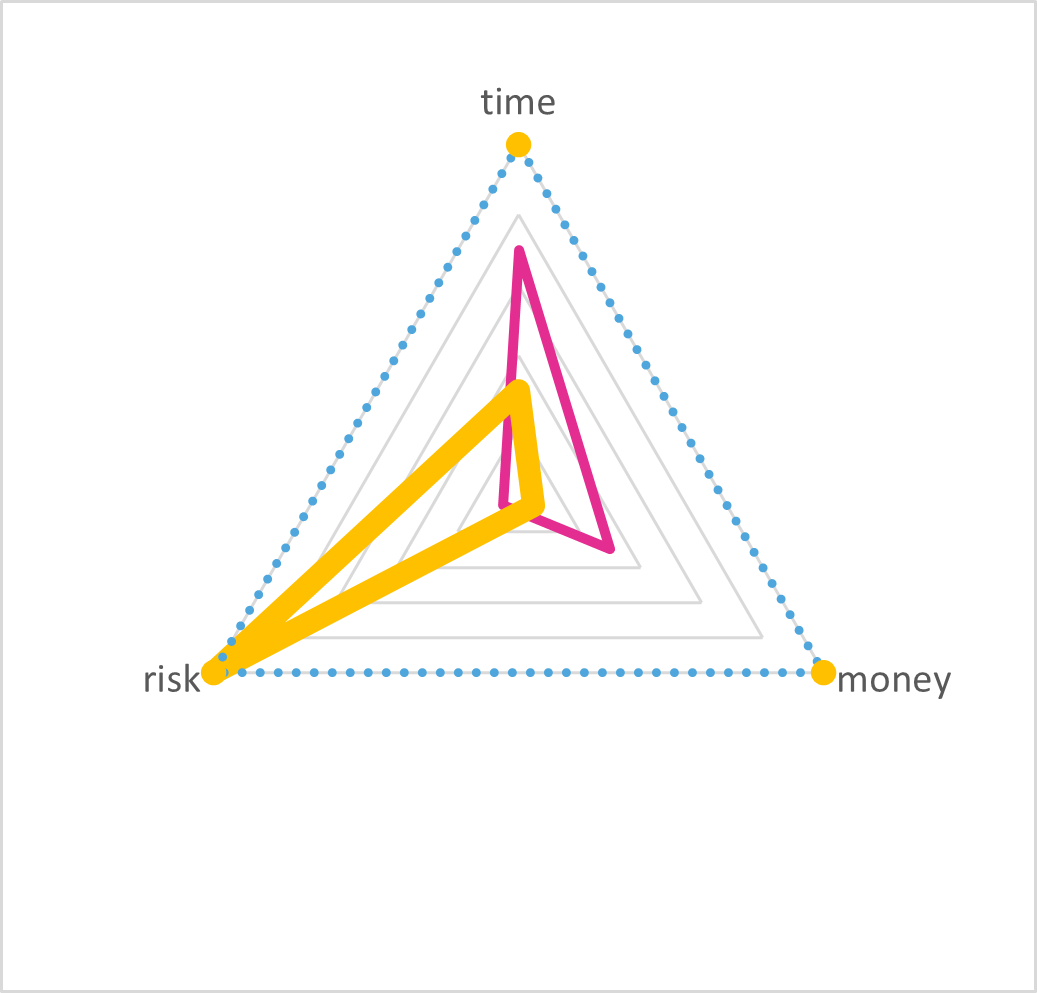
QA and QE teams make sure unit, manual, integration, regression, smoke and load testing happens before a release. Obviously?
Value. QA’s main customers are risk management and product engineering. For risk management, QA reduces the chance that a change to production causes an incident, through all those kinds of testing. For product engineering, the sooner a bug is found, the exponentially less time it takes to fix, so they can focus on delivering their own value.
Price. Time is the biggest expense: testing slows development down significantly. There is a people cost too, but QE engineers usually cost less than other engineers.
Platform (+32%)
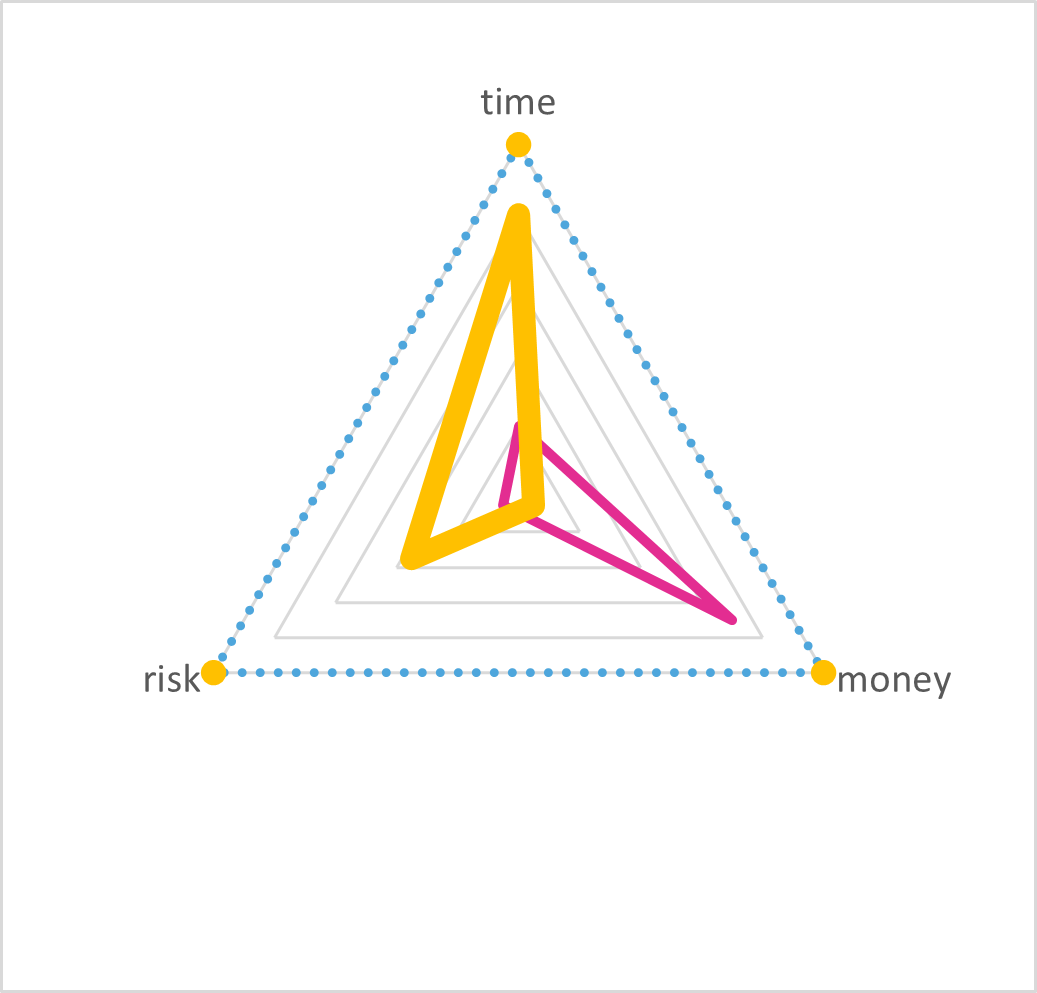
I haven’t seen this team anywhere else, but we had a team focused on the cross-functional parts of software development. Clear as mud?
Value. Snagajob’s platform team’s main customer is product engineering. It cuts the time spent developing new products and features.
Price. Mostly people. Its tooling costs much less than the other platform engineering groups’ do.
Data (+61%)
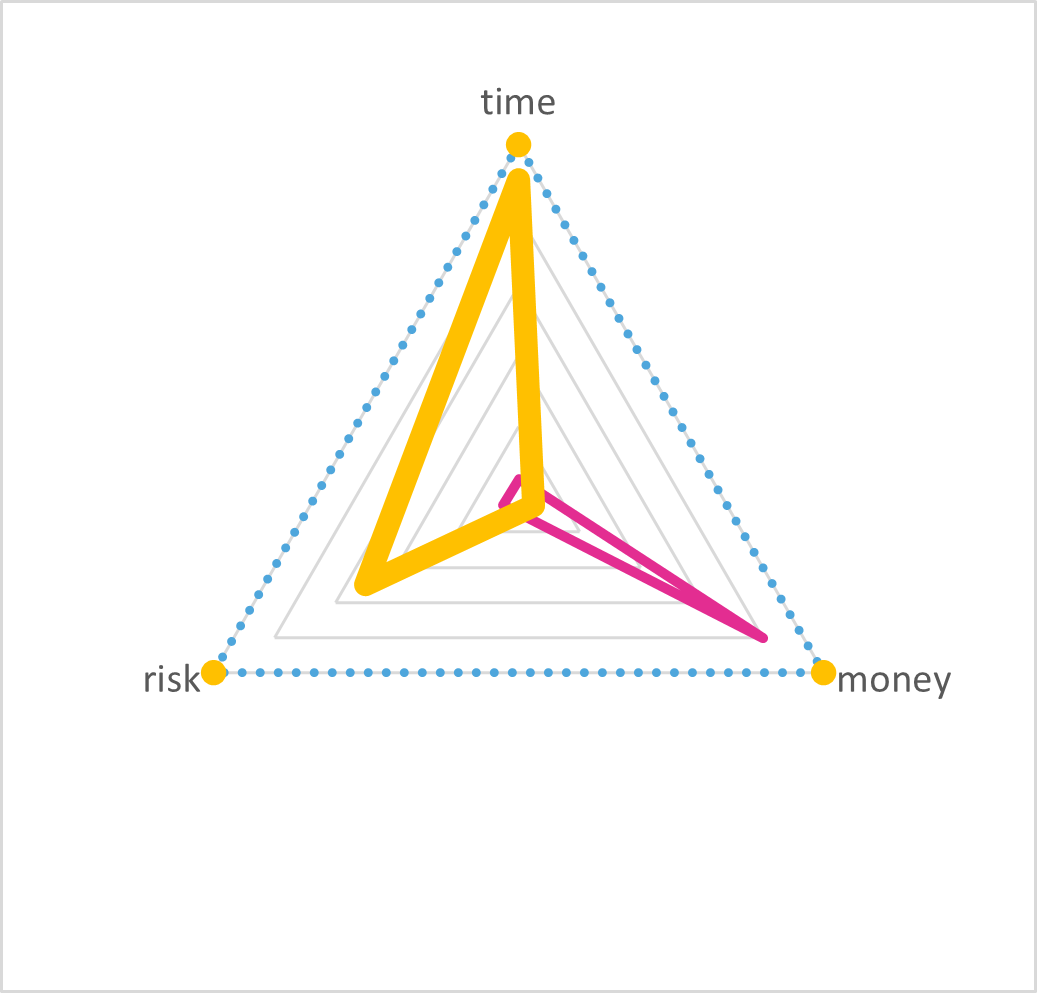
At SaaS companies, data is gold. Transactional data stores, message buses, data warehouses and lakes, ML and AI, data visualization, reporting and backups power every part of the company.
Value. Data’s main customer is every employee, particularly in SaaS. Accurate, secure, timely access to data cuts down on communication across the company, gives direction, and creates a competitive advantage.
Price. Data engineers cost more than most engineers. The tools to store, retrieve and back up data are expensive too.